rdmatop: Cross-Provider htop for RDMA Traffic
By: Chang-Ning Tsai and the UCCL Team — June 15, 2026
RDMA is the backbone of multi-node LLM training and inference, yet most of us run it blind—when throughput is half what it should be, it is hard to see which NIC is hot, which is idle, or whether the bottleneck is on transmit or receive. We built rdmatop, "htop, but for RDMA traffic": a real-time TUI that monitors any Linux RDMA device (NVIDIA ConnectX, AWS EFA, Broadcom) through RDMA netlink. We then walk through real NCCL and NVSHMEM cases where a per-NIC, per-process view made the problem obvious at a glance.
Introduction
If you run InfiniBand fabrics, you have probably used ibtop—a small but invaluable tool that reads InfiniBand hardware performance counters (via the UMAD interface) and organizes bandwidth and traffic by job or host. It answers the everyday operational question: who is using the fabric, and how much?
The trouble is that the RDMA world is no longer just InfiniBand. GPU clusters today run RDMA over an expanding set of providers—NVIDIA/Mellanox ConnectX (RoCE and InfiniBand), AWS EFA, Broadcom Thor/bnxt, AMD Pensando/Pollara—each with its own NIC, counter definitions, and quirks. An InfiniBand-only tool like ibtop cannot see any of these, and writing a separate monitor per vendor does not scale. What practitioners actually need is a provider-agnostic view of RDMA traffic.
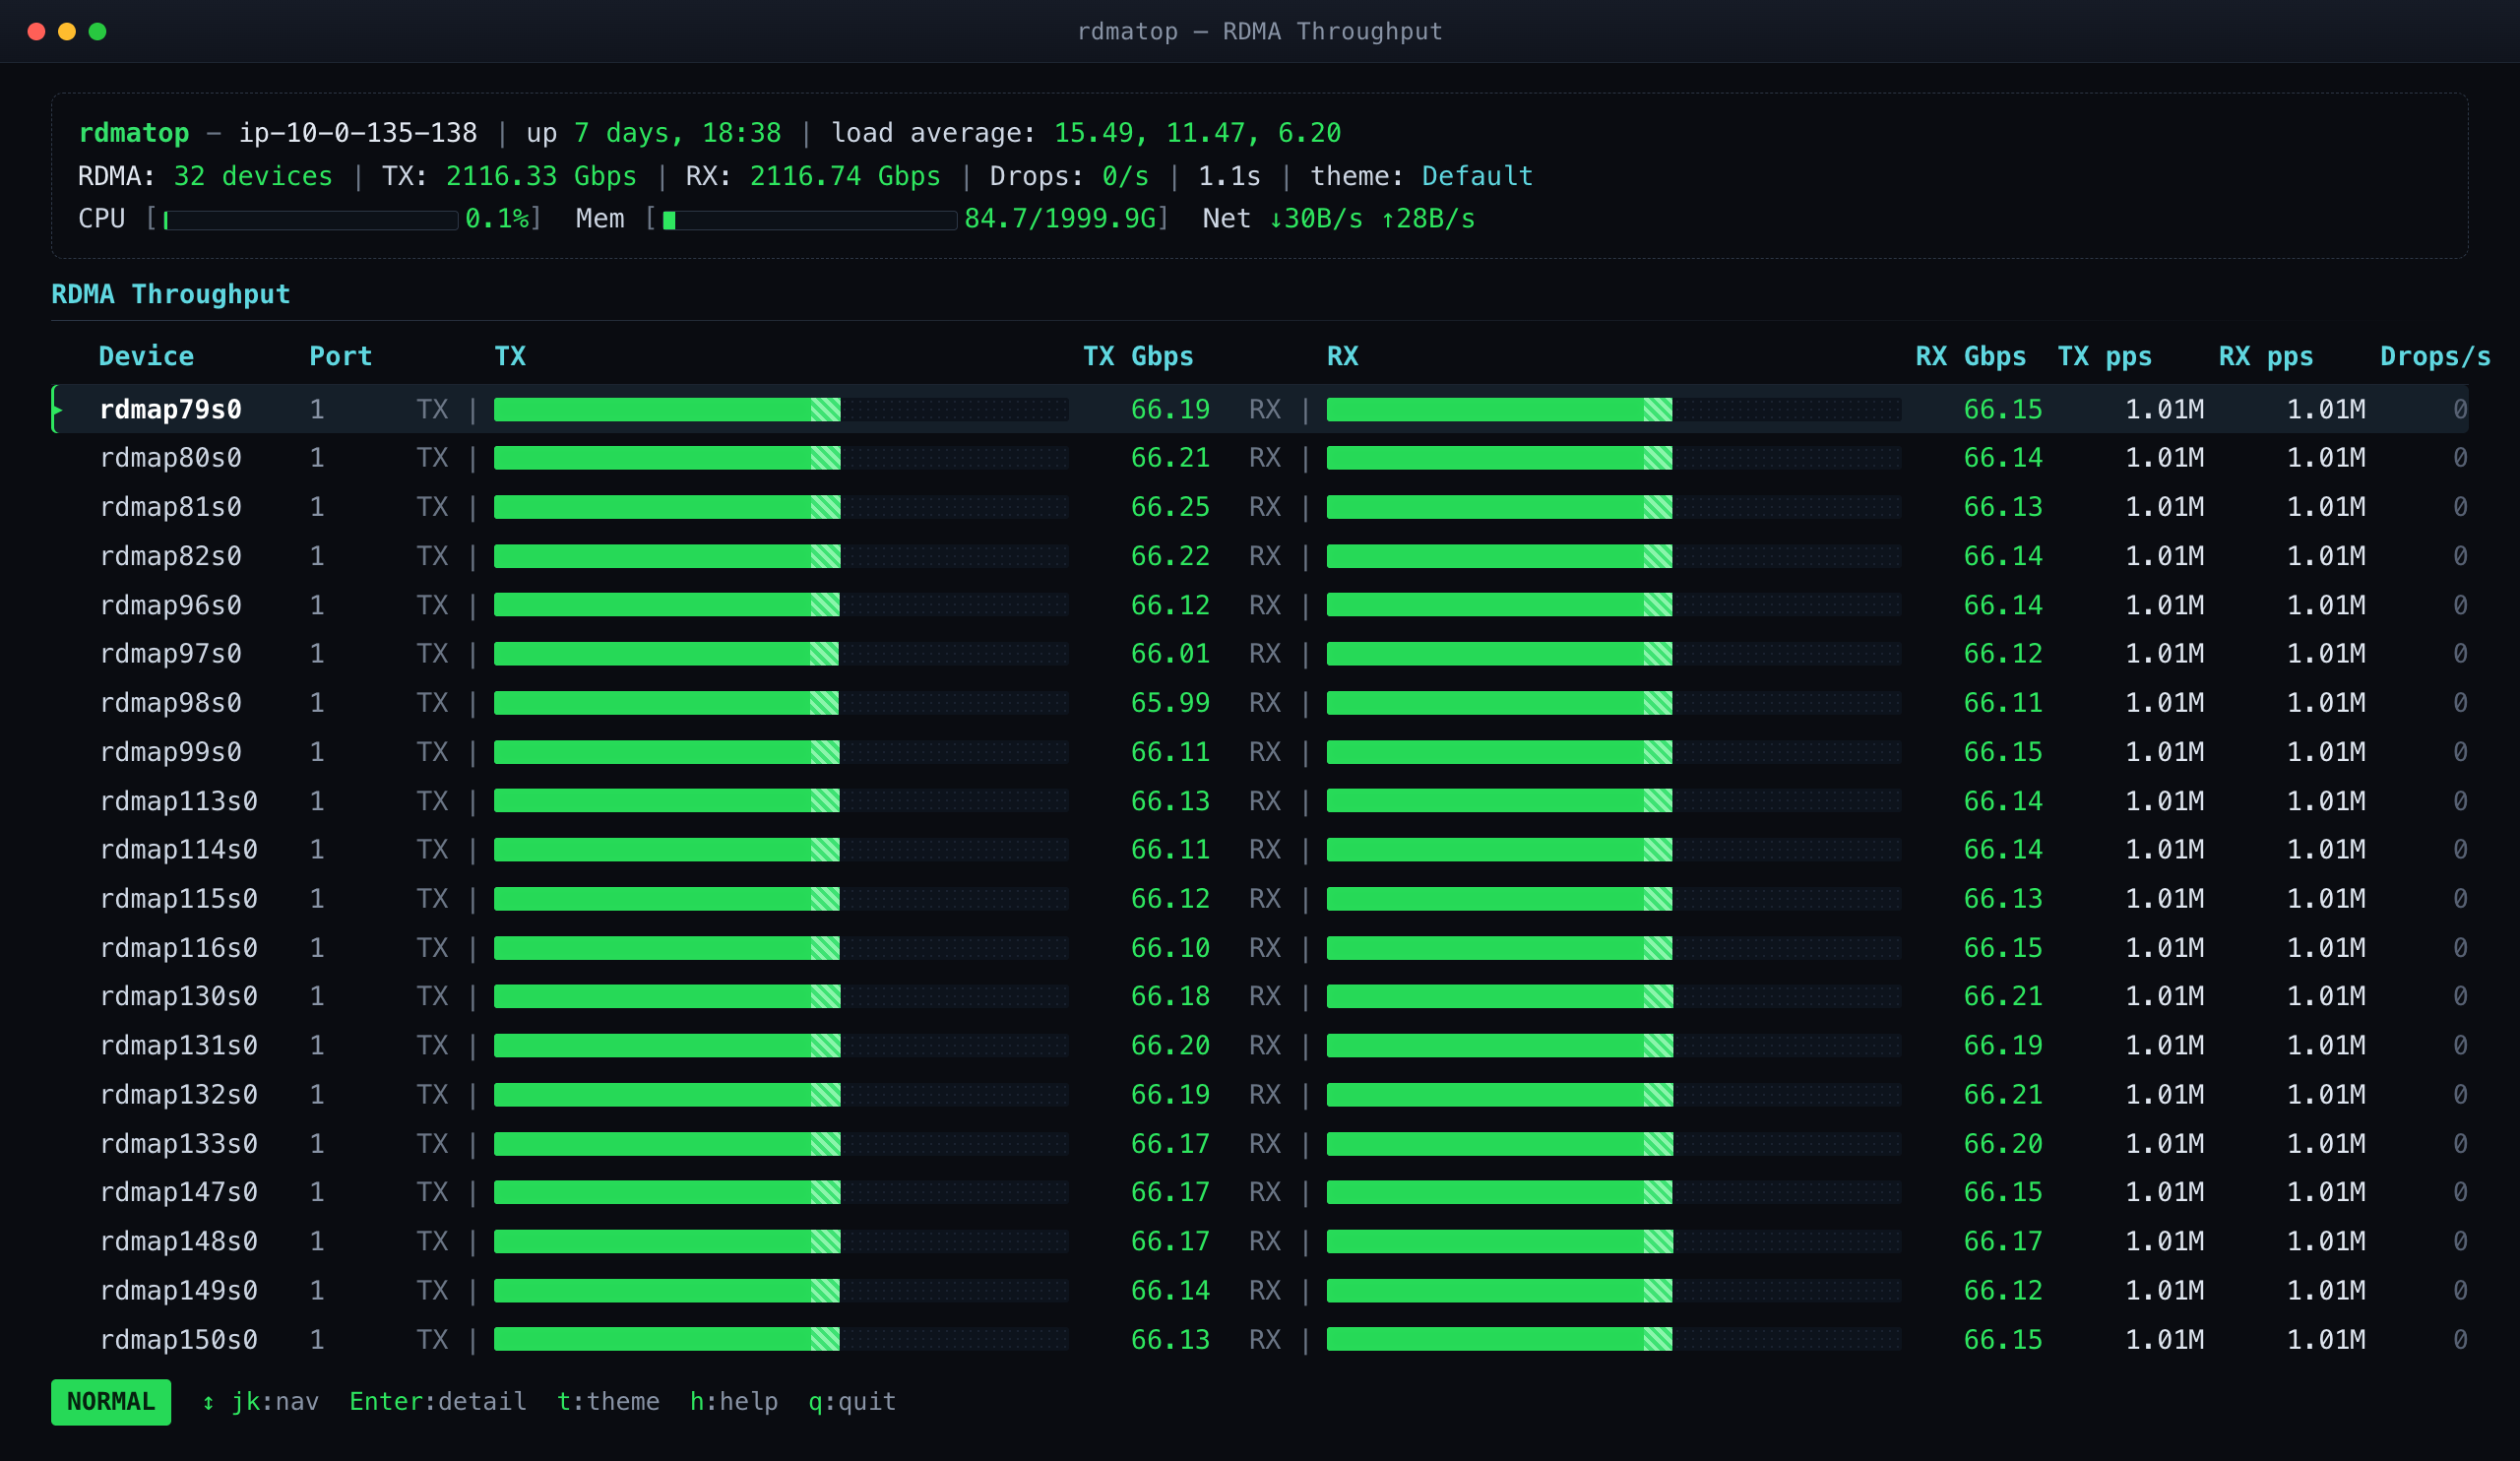
That is exactly what rdmatop provides. Instead of per-vendor counters, it reads RDMA netlink—the same interface behind the rdma statistic command—so it works on any Linux RDMA device, and it maps queue pairs (QPs) back to the processes that own them. The result is a live terminal dashboard of per-device throughput (Gb/s, packets/s, drops), RDMA read/write counters, retransmissions, and—crucially—which process is driving each device. That per-NIC, per-process, Tx-vs-Rx visibility is what turns “the job is slow” into “GPU 0’s traffic is all landing on a single NIC.”
Installation
rdmatop is a single static binary with no daemon and no cluster to stand up—you can have it running in under a minute. On Ubuntu, install it from our PPA:
sudo add-apt-repository ppa:crazyguitar/rdmatop
sudo apt update
sudo apt install rdmatop
Or, on any platform with a Rust toolchain, install it straight from crates.io:
cargo install rdmatopThen run rdmatop on any node with RDMA devices and the live per-NIC view comes up right away. The case studies below are the kind of problem it makes obvious at a glance.
Case Study 1: AWS Already Has an EFA Exporter—So Why a TUI?
AWS does provide an example: its distributed-training repo (for EKS and SageMaker HyperPod) documents an EFA node exporter that scrapes EFA traffic into Prometheus and Grafana for fleet-wide dashboards. Deploying that exporter is not always convenient, though—on a Slurm cluster, or any node you simply SSH into, there is usually no Prometheus/Grafana stack, and bringing one up just to inspect a single host is a lot of moving parts for a quick look.
That is the gap rdmatop fills: a single binary, no cluster and no Grafana, showing live per-NIC, per-process Tx/Rx rates the moment you run it on the node. The case studies below show what that immediacy buys.
Case Study 2: NCCL Silently Falling Back to TCP Sockets
NCCL is the default collective library for distributed training and inference, and on EFA it should move data over RDMA through the libfabric (OFI) plugin. If that plugin is mislinked or misconfigured, NCCL silently falls back to kernel TCP sockets—RDMA disabled—and collective throughput can crater by up to an order of magnitude (~10×). The job still runs and converges; it is just far slower.
The only clue is one line in the NCCL_DEBUG=INFO output:
# wrong — silently fell back to TCP sockets
NCCL INFO Using network Socket

# correct — using EFA via libfabric
NCCL INFO Using network Libfabric
In a multi-node training run or a hosted inference service, nobody is watching initialization logs, and the log volume buries that one line (see uccl#734). rdmatop surfaces the fallback instantly: on sockets, the EFA NICs show near-zero RDMA traffic even while the GPUs are clearly communicating. Flat RDMA counters mean you are not on RDMA—no log archaeology required.
Case Study 3: NVSHMEM ≤ 3.5.21 Silently Used Only One of Many EFA NICs
AWS GPU instances ship with multiple EFA NICs per node so each GPU can drive more network bandwidth—but for a long time, NVSHMEM1 could not use them all.
In NVSHMEM 3.5.21 and earlier, the libfabric transport bound each GPU to a single EFA NIC, capping its point-to-point throughput at one NIC’s bandwidth and leaving the rest of an expensive multi-NIC system idle. Workloads looked mysteriously slow, with no hint why at the application level.
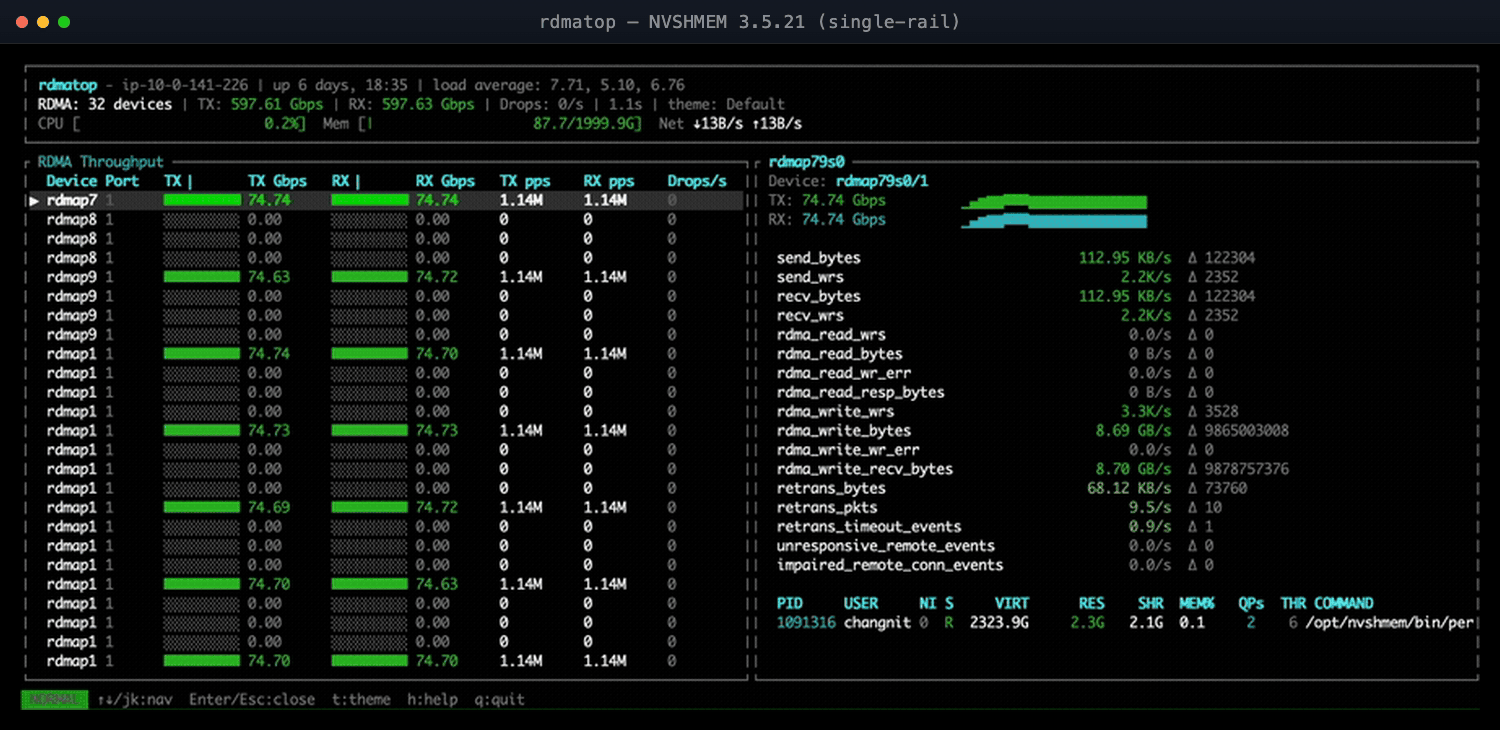
Figure 1: NVSHMEM 3.5.21—only a few EFA NICs carry traffic; the rest sit at 0.00.
An RDMA monitor makes this unambiguous: rdmatop shows one EFA NIC pinned near line rate while its siblings sit at zero—no theory, no guesswork. (For the full single- vs. multi-NIC write-up, see the NVSHMEM Multi-NIC notes.2)
Case Study 4: Multi-Rail Was Added, But Throughput Did Not Scale
NVSHMEM 3.6.5 added round-robin NIC selection so a single GPU could spray traffic across all its EFA NICs. With four NICs we expected throughput to scale roughly 4×—but all-to-all refused to, sometimes coming out slower than a single NIC.
rdmatop on the destination node made the cause obvious: transmit (Tx) traffic spread evenly across all NICs, but receive (Rx) traffic funneled onto one NIC. Round-robin balanced sends but not receives—every sender picked the same remote NIC for a given destination—and that lone receive-side hotspot capped the job.
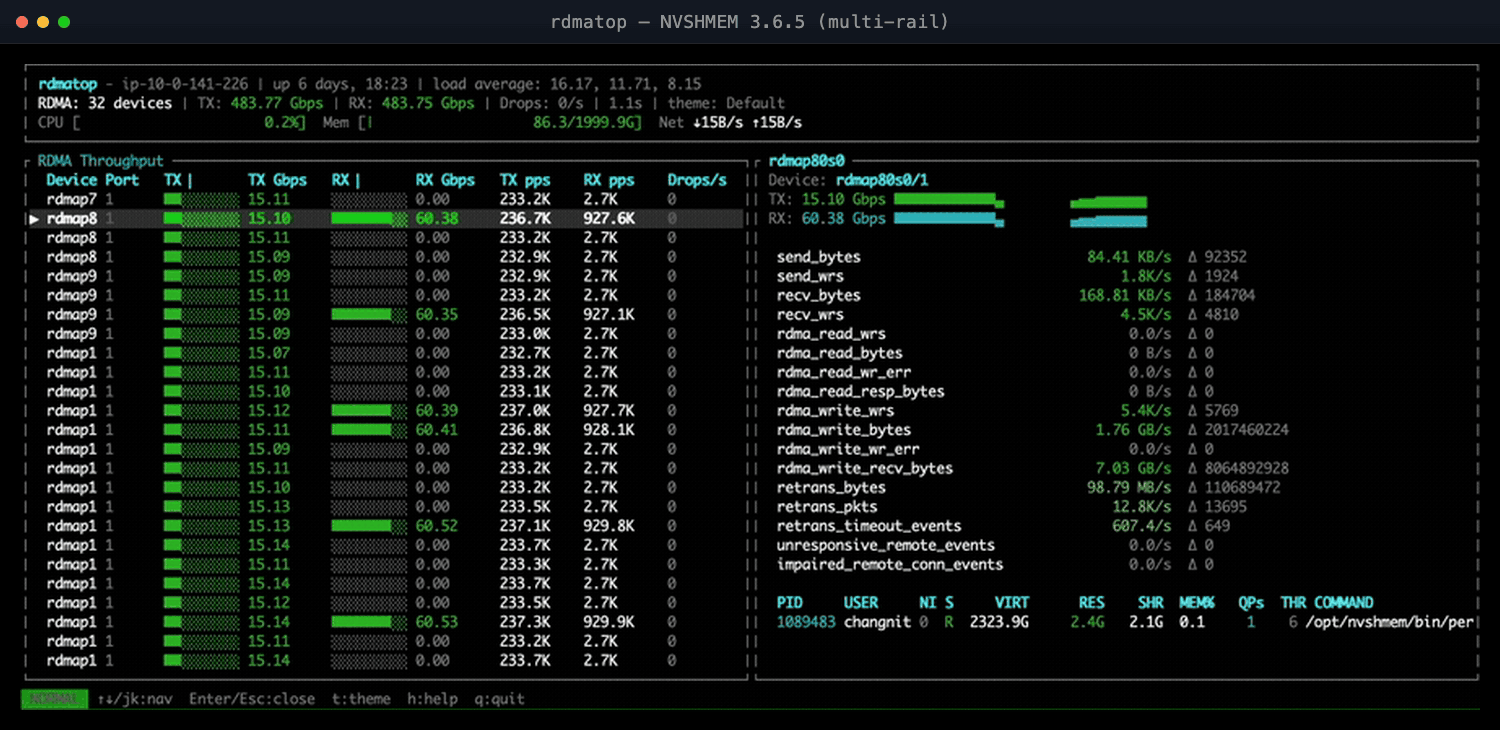
Figure 2: NVSHMEM 3.6.5 multi-rail—Tx spreads across all NICs, but Rx funnels onto a few.
The fix in NVIDIA/nvshmem#76 spreads remote-NIC selection per sender, so receives land on different NICs and throughput scales as expected; the PR has the details and benchmarks.
Case Study 5: Try It Yourself with the Bundled Examples
You do not need a broken cluster to see what rdmatop shows. The repo ships ready-to-run examples that generate RDMA traffic across the frameworks people actually use—ib and rdma verbs microbenchmarks, ucx, nccl, nvshmem, nixl, and pplx—plus deployment recipes for real clusters.
On Kubernetes, run rdmatop as a DaemonSet so every GPU node is covered, then attach to any pod’s TUI:
kubectl apply -f examples/kubernetes/daemonset.yaml
kubectl exec -it <rdmatop-pod> -- rdmatop
The DaemonSet runs with hostNetwork, hostPID, and the NET_ADMIN capability so it can read host RDMA devices and map queue pairs to the processes that own them.
On Slurm, submit your job, then open an interactive shell on one of its allocated nodes and watch the traffic live:
srun --jobid=$JOBID --overlap --pty bash   # hop onto a running job's node
rdmatop
Beyond debugging, this is how you tell whether a workload is compute-bound or communication-bound. In prefill–decode (PD) disaggregation, for example, the KV cache streams over RDMA from prefill to decode GPUs: if rdmatop shows those NICs saturated, the transfer is your bottleneck; if they sit near idle while the GPUs stay busy, the network is not what is holding you back. It is the fastest way to learn both the tool and your workload before you need it in production.
Conclusion
The debugging cases above share a theme: the hardware was capable, but it was being used wrong—idle because traffic fell back to TCP, capped to a single rail, or funneled onto one NIC—and each failure was effectively invisible at the application layer. The job ran; it was simply slow. Each took real investigation to track down.
A per-NIC, per-process, Tx-vs-Rx monitor collapses that investigation into a glance. As RDMA fans out across EFA, ConnectX, Broadcom, and AMD, a tool that reads every one of them through a single vendor-neutral interface becomes essential rather than nice-to-have. That is the gap rdmatop is built to fill—htop, but for RDMA traffic. We welcome issues and contributions.
References
Footnotes